Console logs play an essential role in debugging and error handling. They help our developers identify issues and analyse unexpected errors. By providing details about the errors a user has run into, console logs lead to a much faster diagnosis and resolution.
What Are Console Logs?
Console logs are debugging logs that are captured by the web browser. They can contain warnings, errors and other information, and they are especially helpful for any development team trying to narrow down the source of an issue. You can collect them by following the simple steps below.
How to Capture the Console Logs
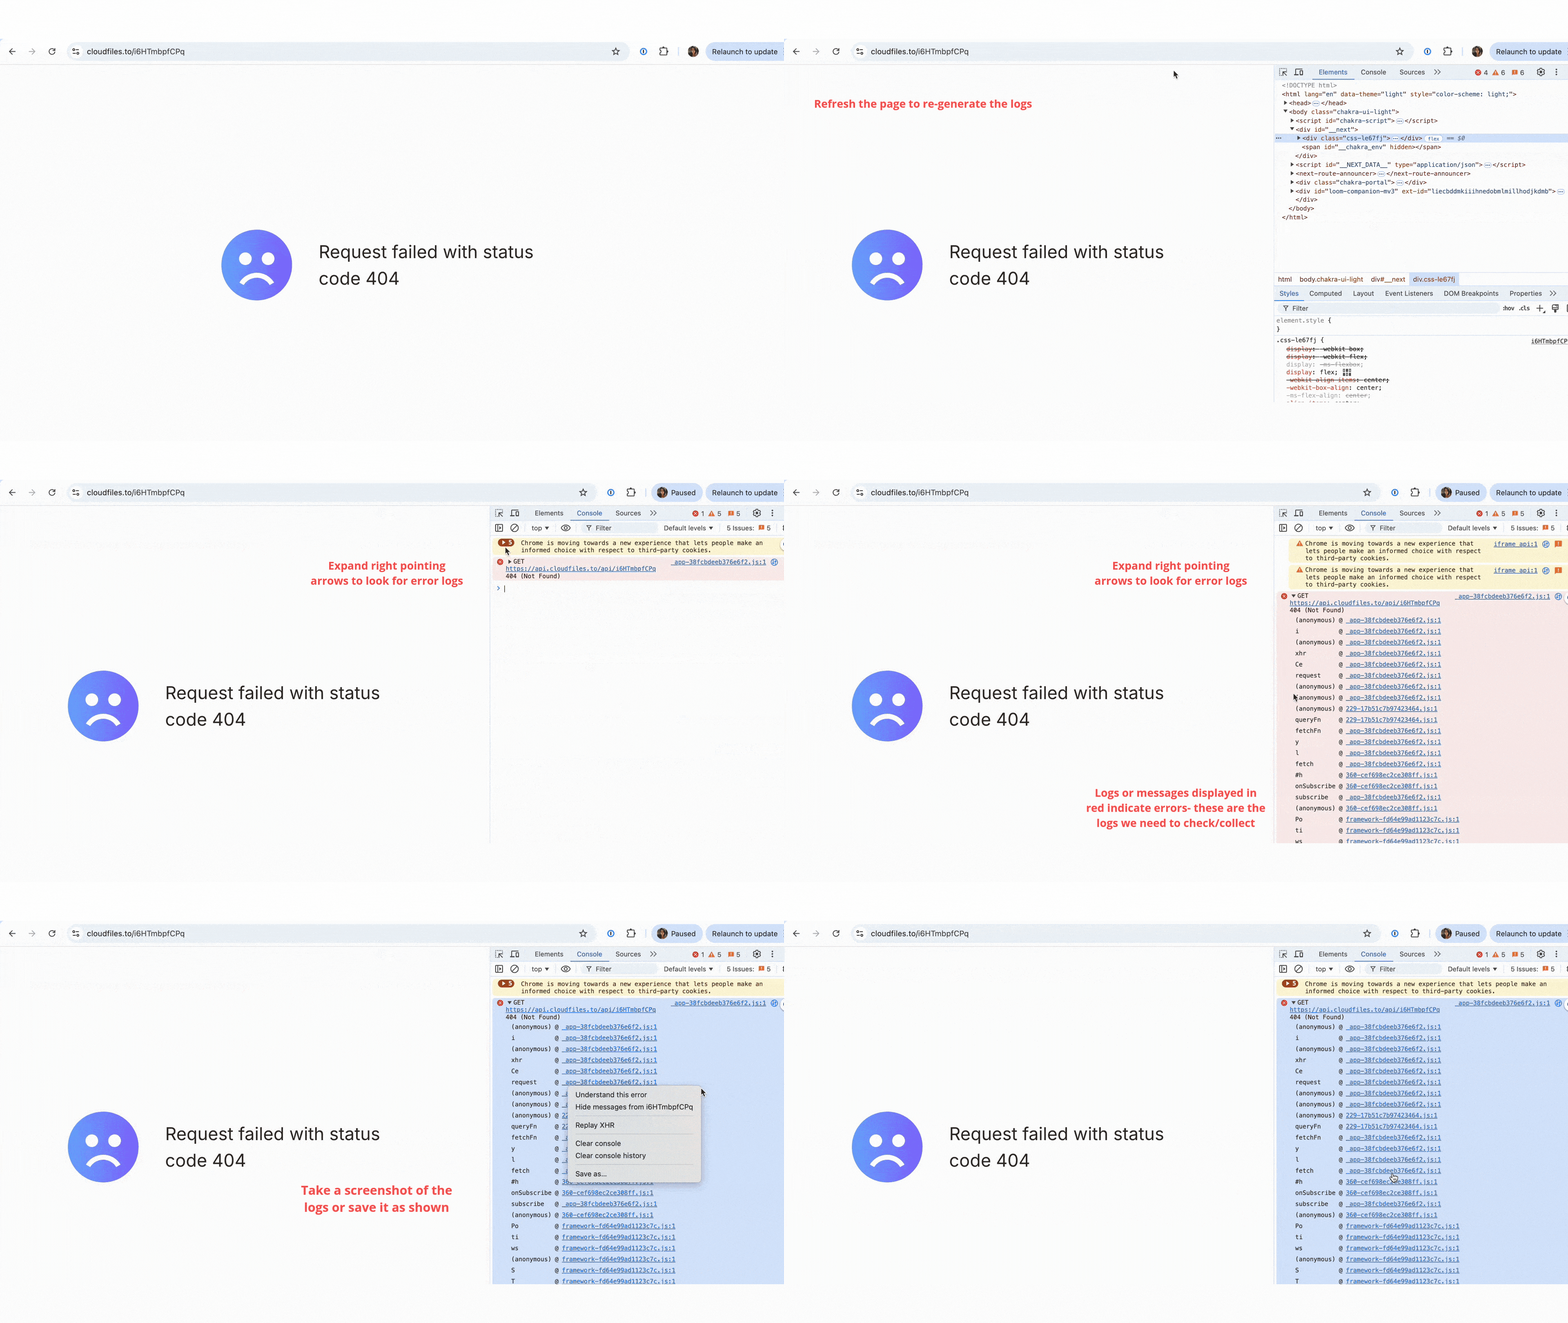
To capture the console logs, we will first access the developer tools, go to the console, reproduce the issue and get the relevant logs. The GIF below is a complete demonstration of how to collect the logs. If you need a detailed explanation, refer to the steps that follow.
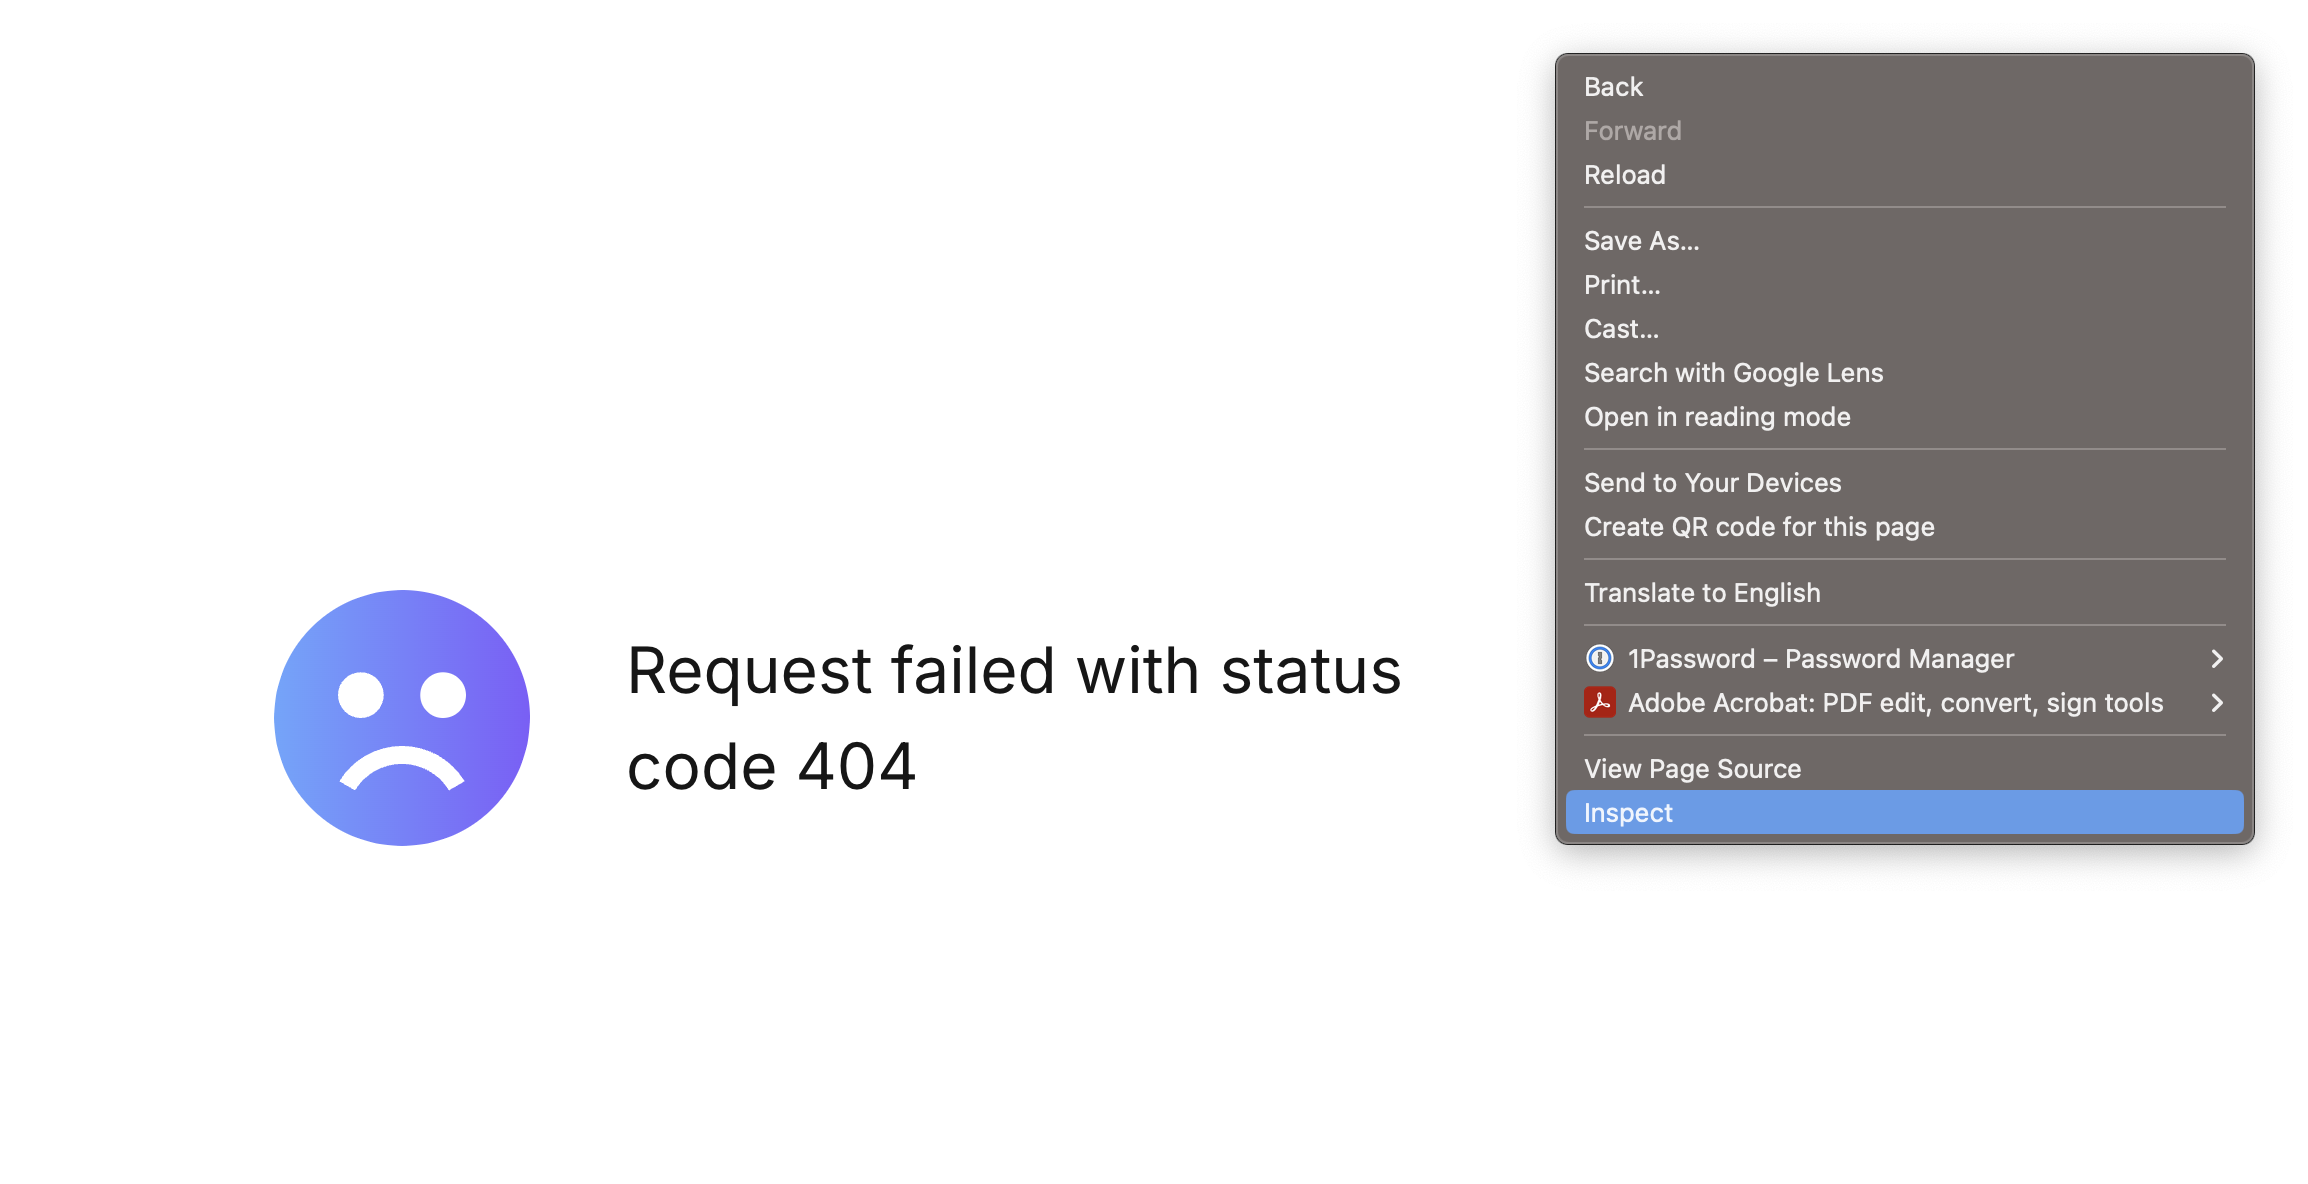
Step 1 - Open Developer Tools
In most web browsers (Chrome, Safari, Firefox, Edge), you can open developer tools by right-clicking on the page and selecting Inspect, or by pressing F12 (Ctrl + Shift + I on Windows, or Cmd + Option + I on Mac).
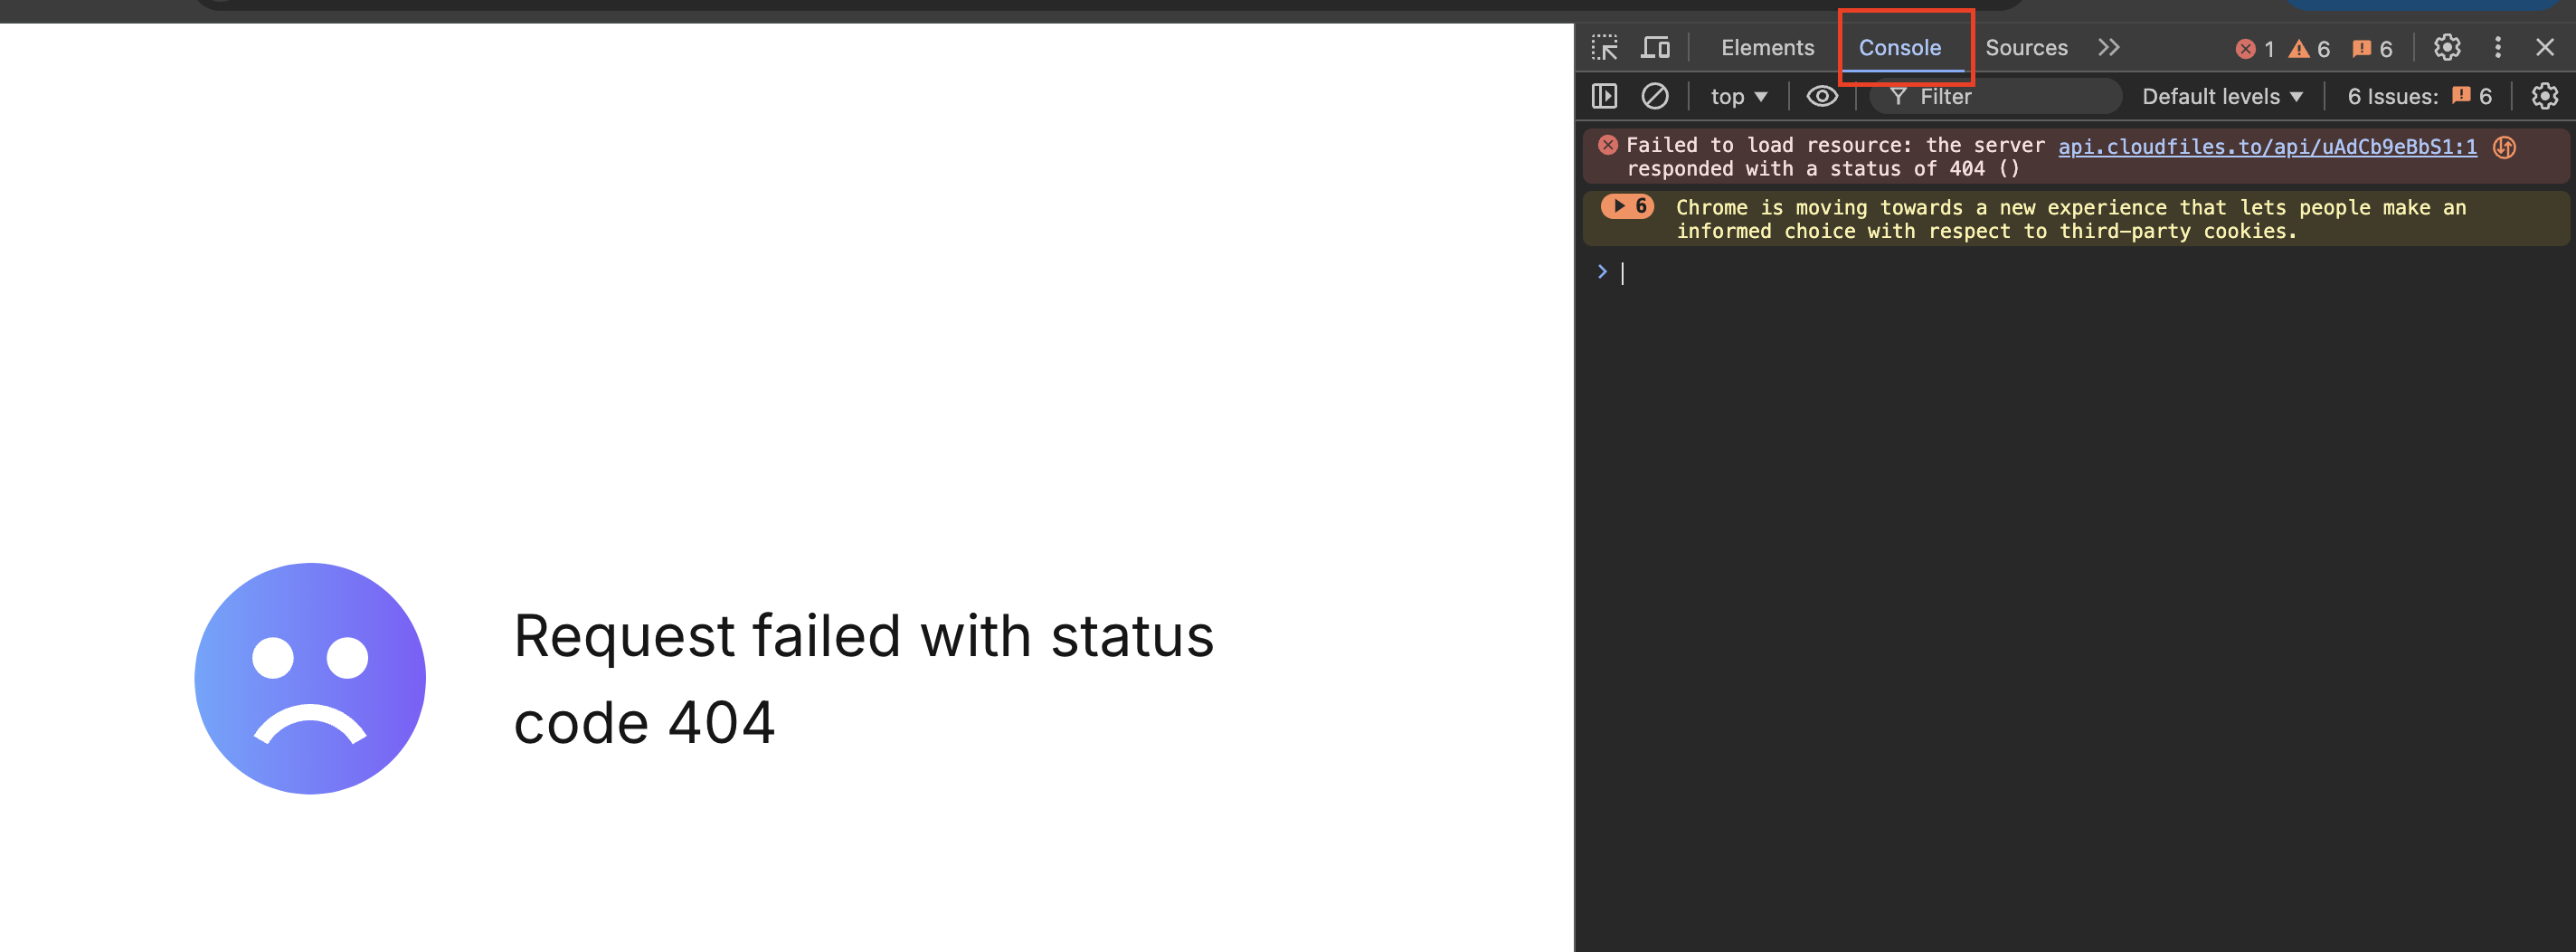
Step 2 - Access the Console Tab
Click on the Console tab in the developer tools panel, as shown in the image below. The Console tab sits along the top of the developer tools. Optionally, you can also clear the existing logs, since we are going to reproduce the issue in the next step.
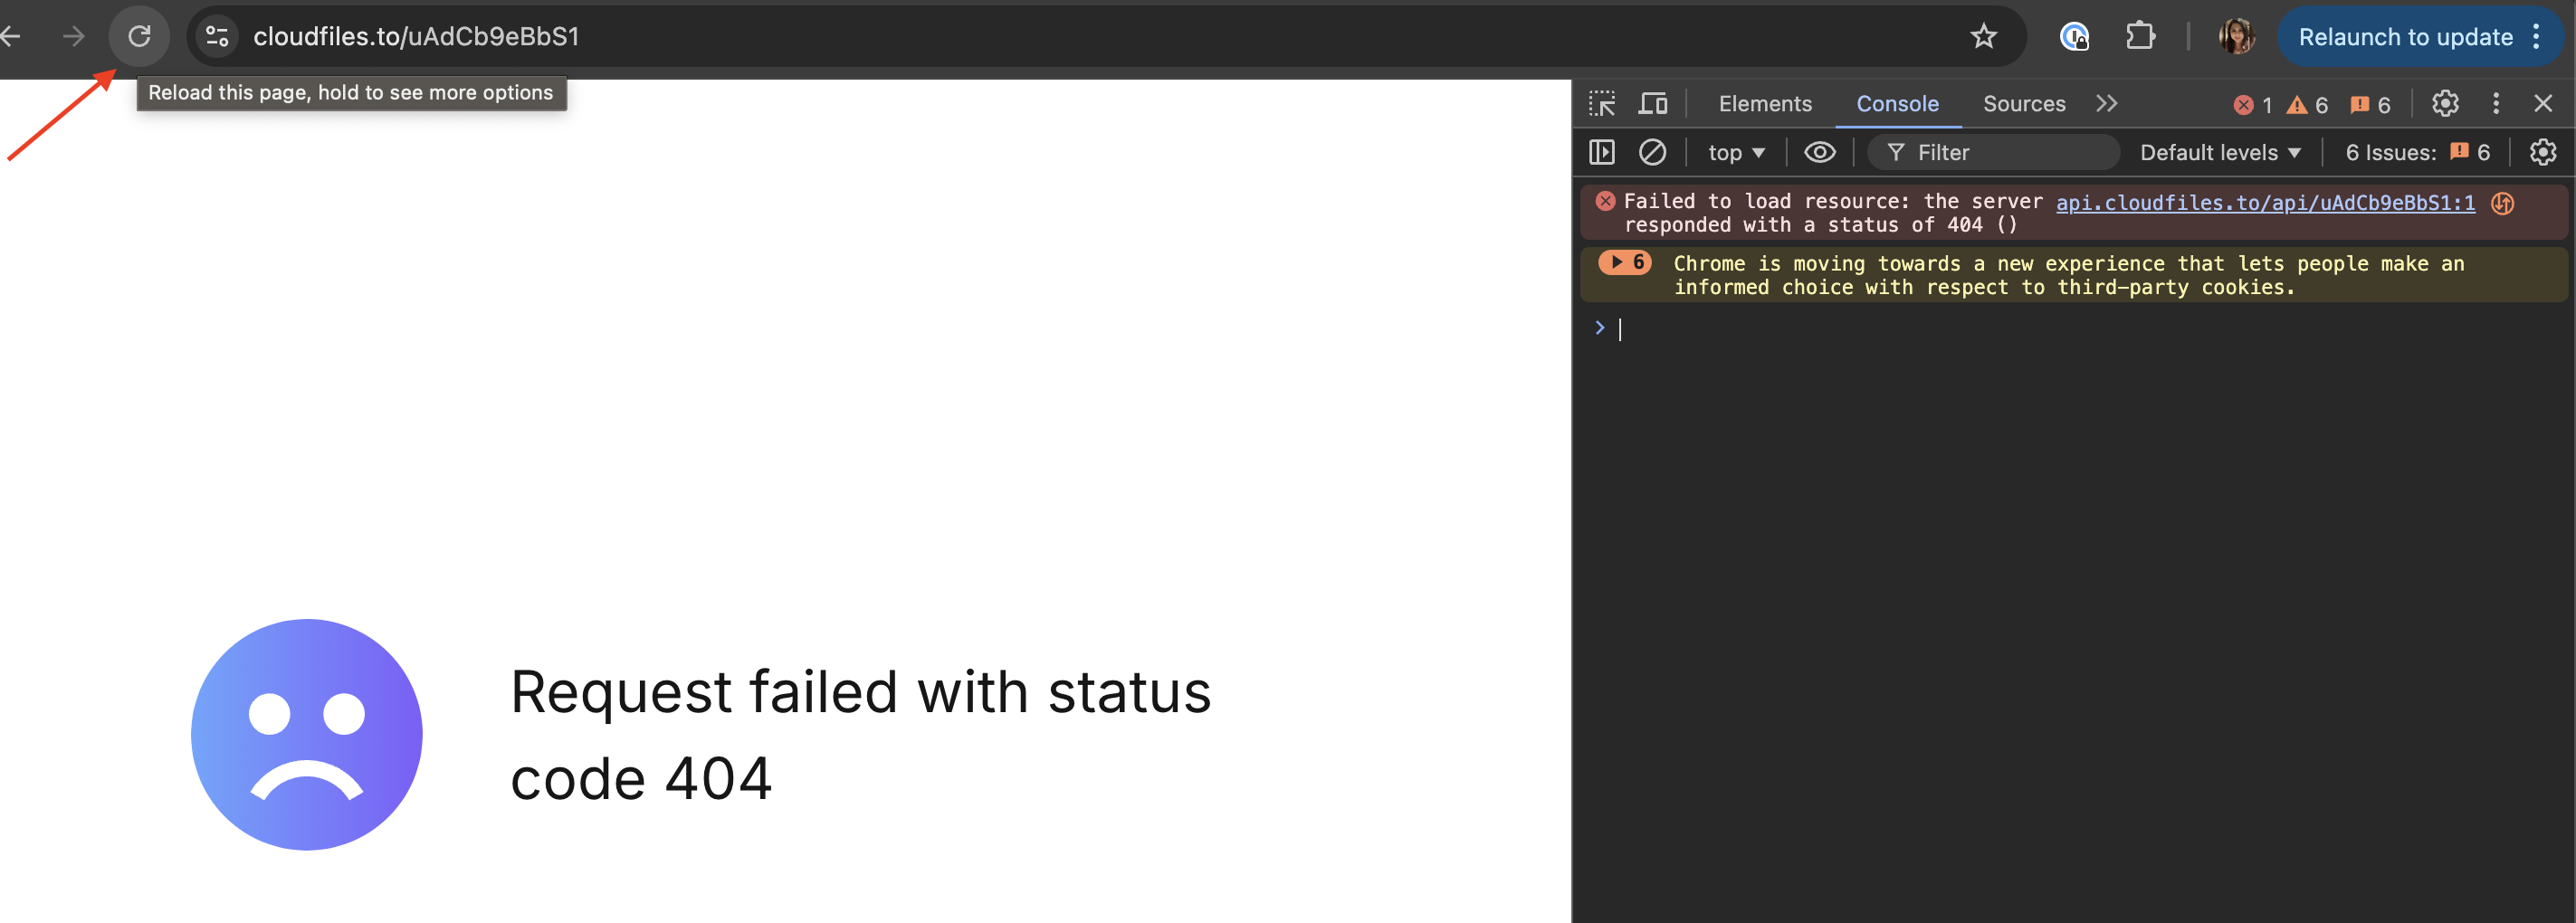
Step 3 - Reproduce the Issue
Once you have navigated to the Console tab, it is always a good practice to reproduce the issue, which you can do by refreshing the page. Refresh the webpage by clicking the reload icon at the top left, or press F5 (Ctrl + R on Windows, or Command + R on Mac).
Refreshing a webpage before collecting logs from the console helps regenerate the logs, and ensures that you capture the most current and relevant logs that have occurred since the last load.
Step 4 - Looking for the Right Logs
Logs or messages displayed in red indicate errors. These are the logs we need you to collect. The logs are usually collapsed by default, so you need to expand them in order to collect the right details. Look for the right-pointing arrows shown in the image below, which expand the logs.
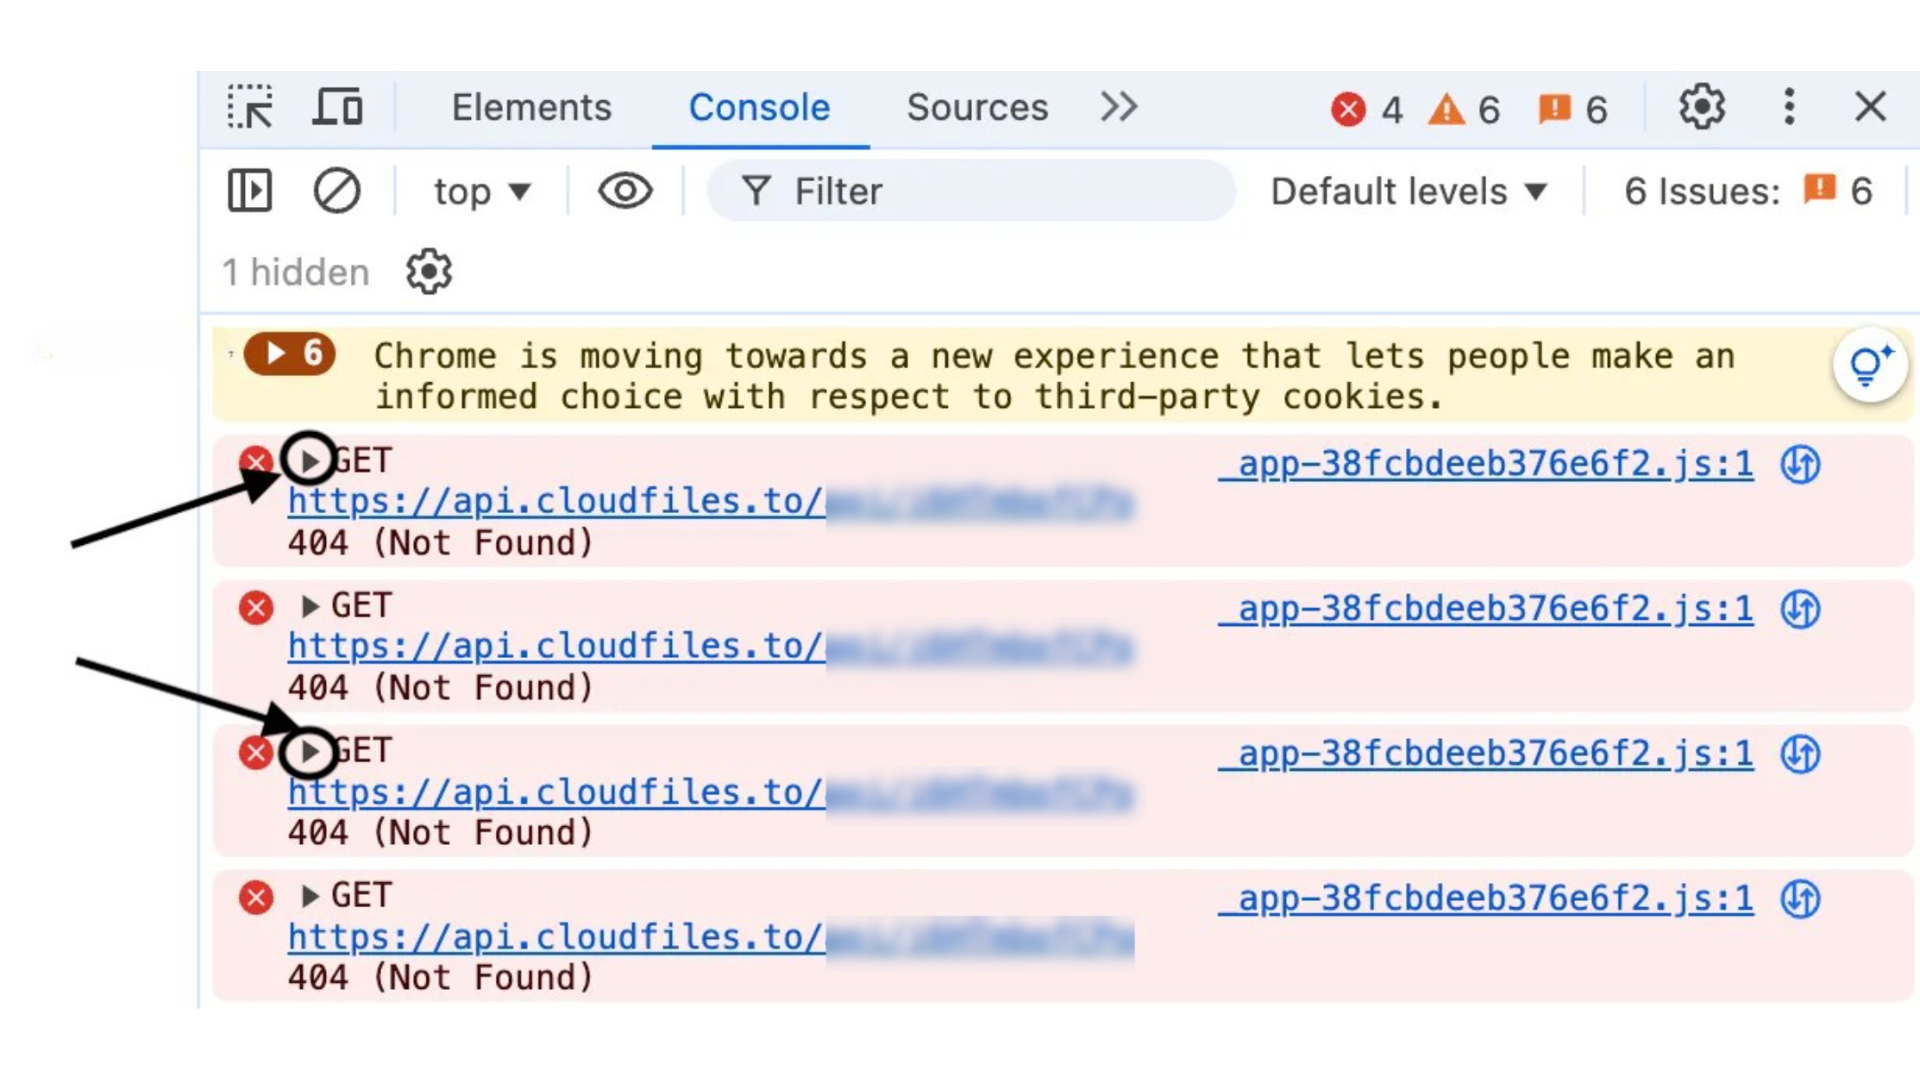
Make sure to expand all the right-pointing arrows in red to check for error log details.
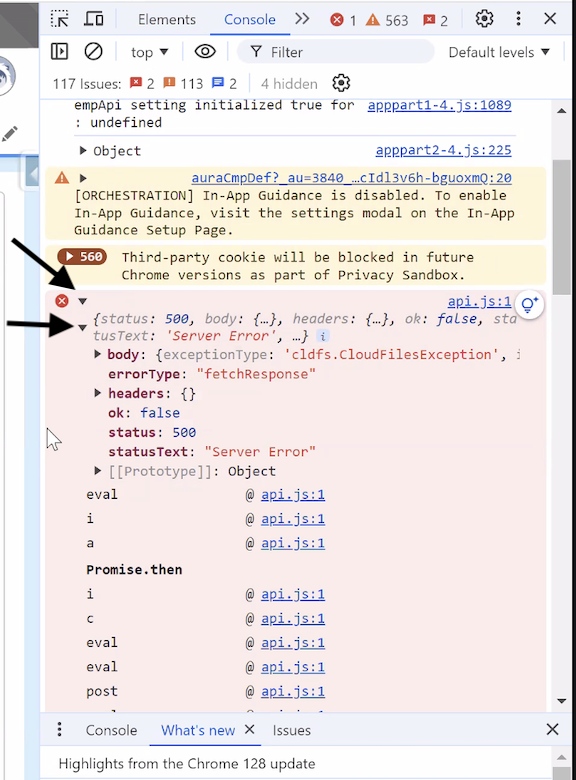
For example, in the image below there are 2 indicators, and the 2nd one is equally important, as the error message can be found in that section.
Step 5 - Sending us the Logs
Use our email support@cloudfiles.io or chat to send us the screenshots captured above. This will help our development team quickly narrow down the issue and resolve it.
Make sure to expand the arrows as shown above, so that all the relevant details are shared in the screenshots that you send us.
Need help? Book time with our team of experts.