Introduction
The Document Generation usage view helps you monitor how many documents generated using CloudFiles document generation and automations credits consumed over time. It provides visibility into usage in current billing period, historical trends and how usage is distributed across templates and HubSpot users.
Accessing Document Generation Usage
To access the Document Management usage view:
- Open the CloudFiles app for HubSpot.
- Select Document Generation tab in the top navigation bar.
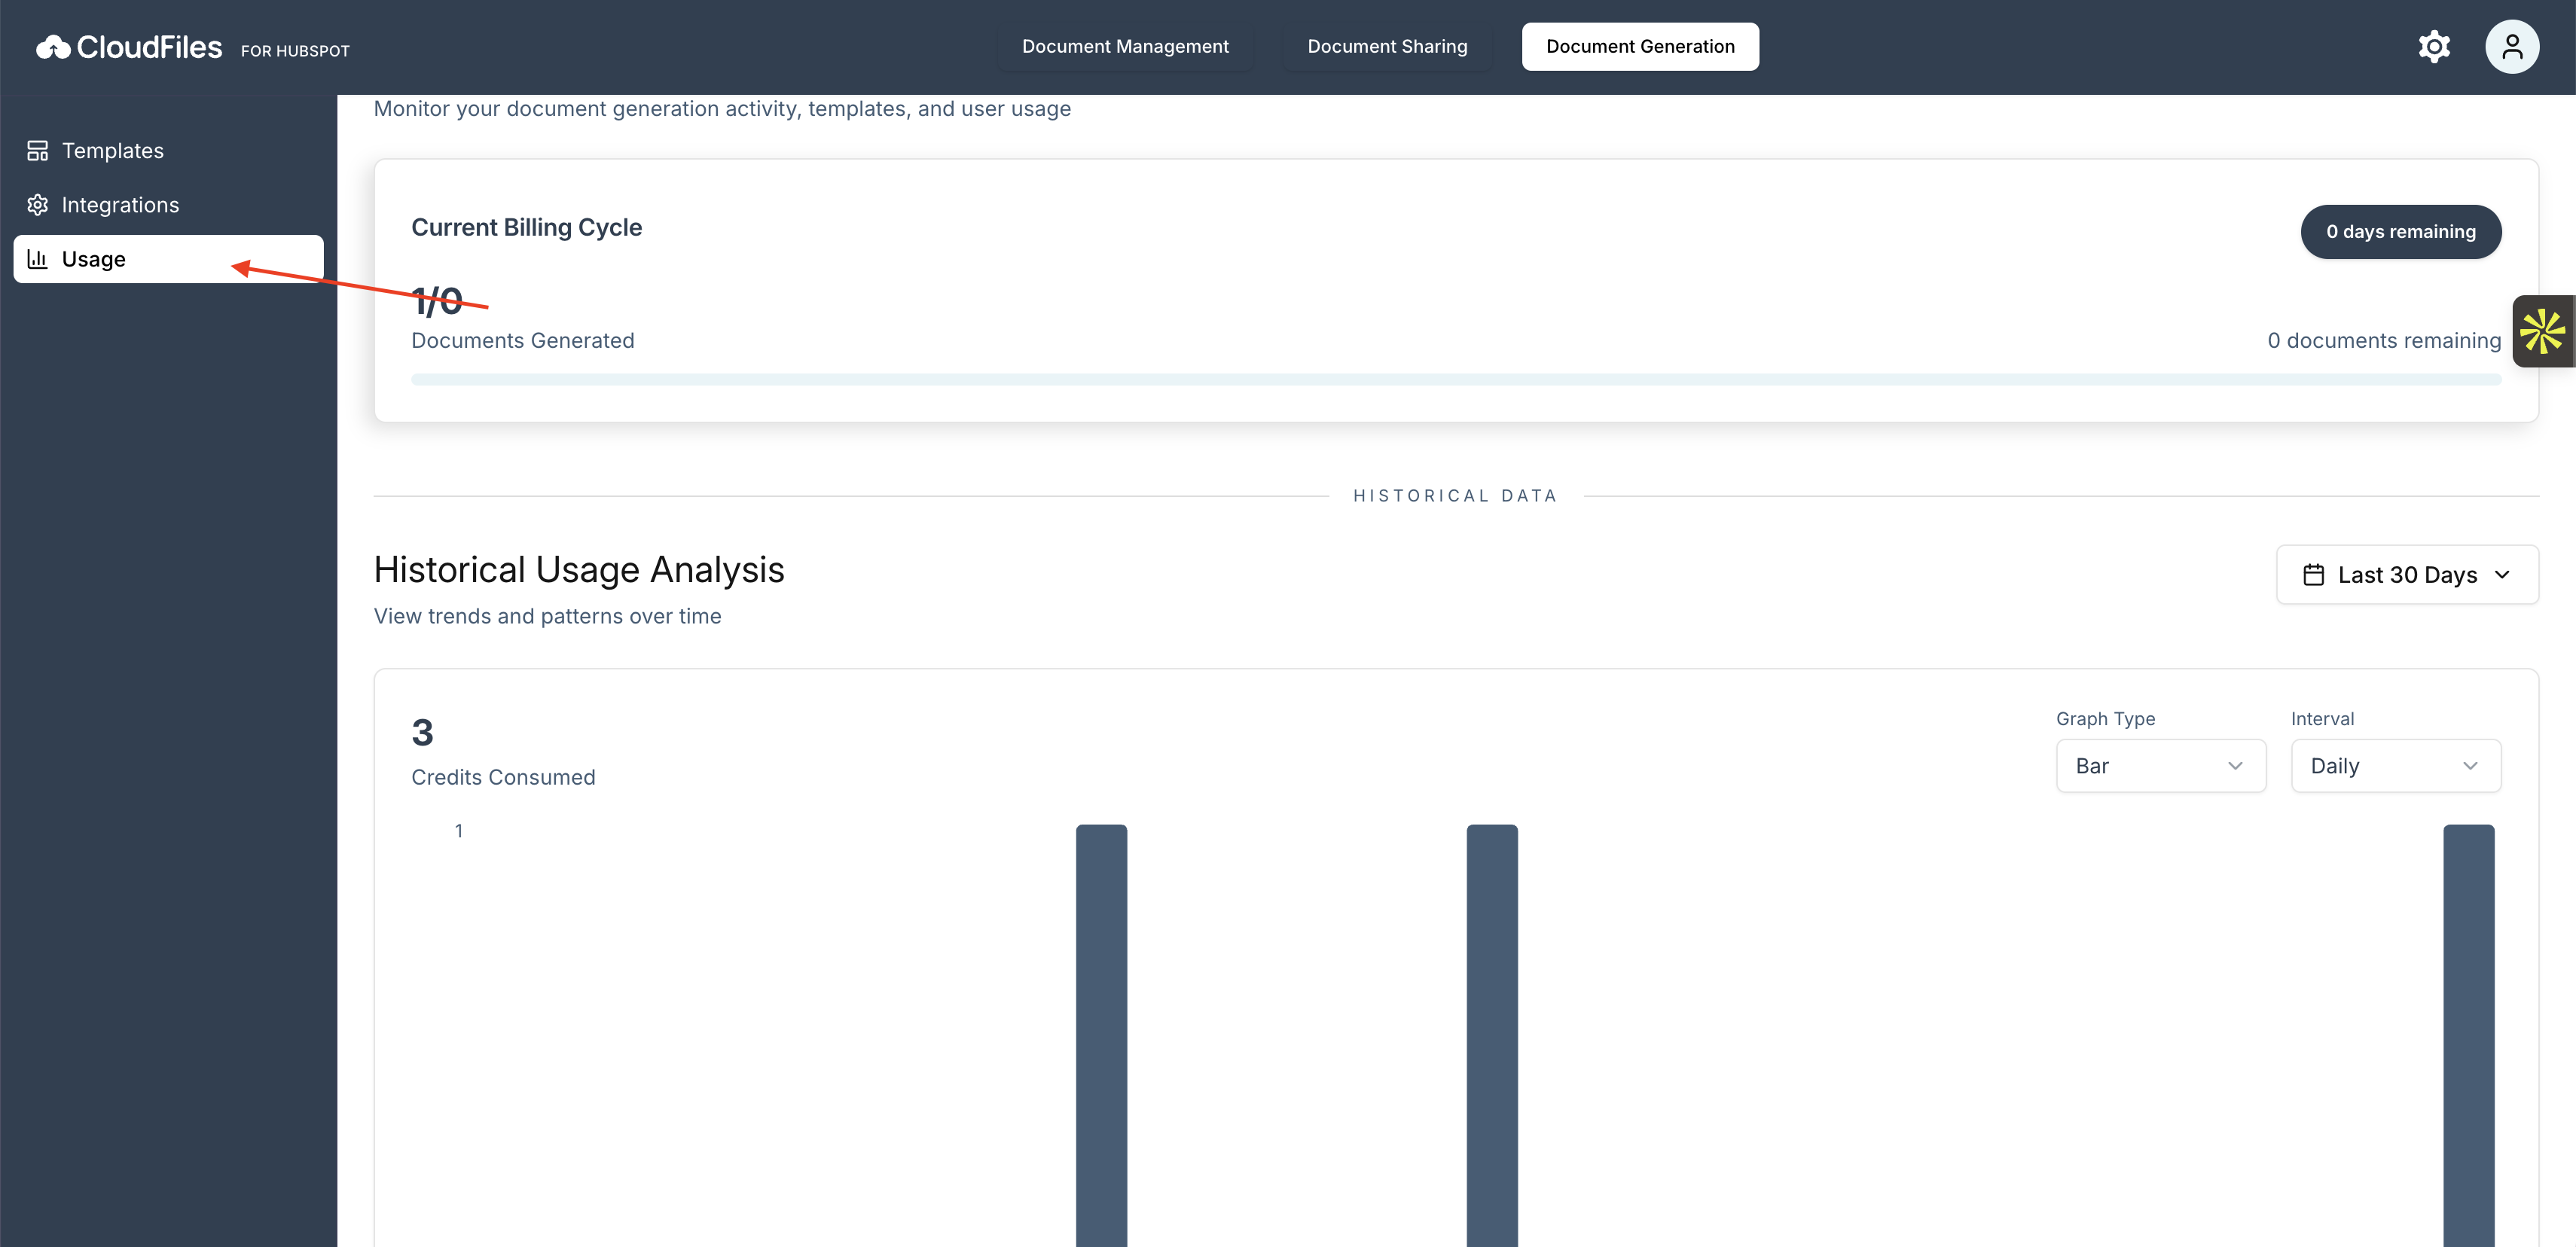
- From the left sidebar, click Usage.
Sections Available in the Usage View
The usage view is divided into multiple sections that provide an overview of usage in current billing period, historical usage trends and a detailed breakdown of how many documents are generated by template and HubSpot users. Each section focuses on a specific aspect of document Generation usage.
Usage Summary Card
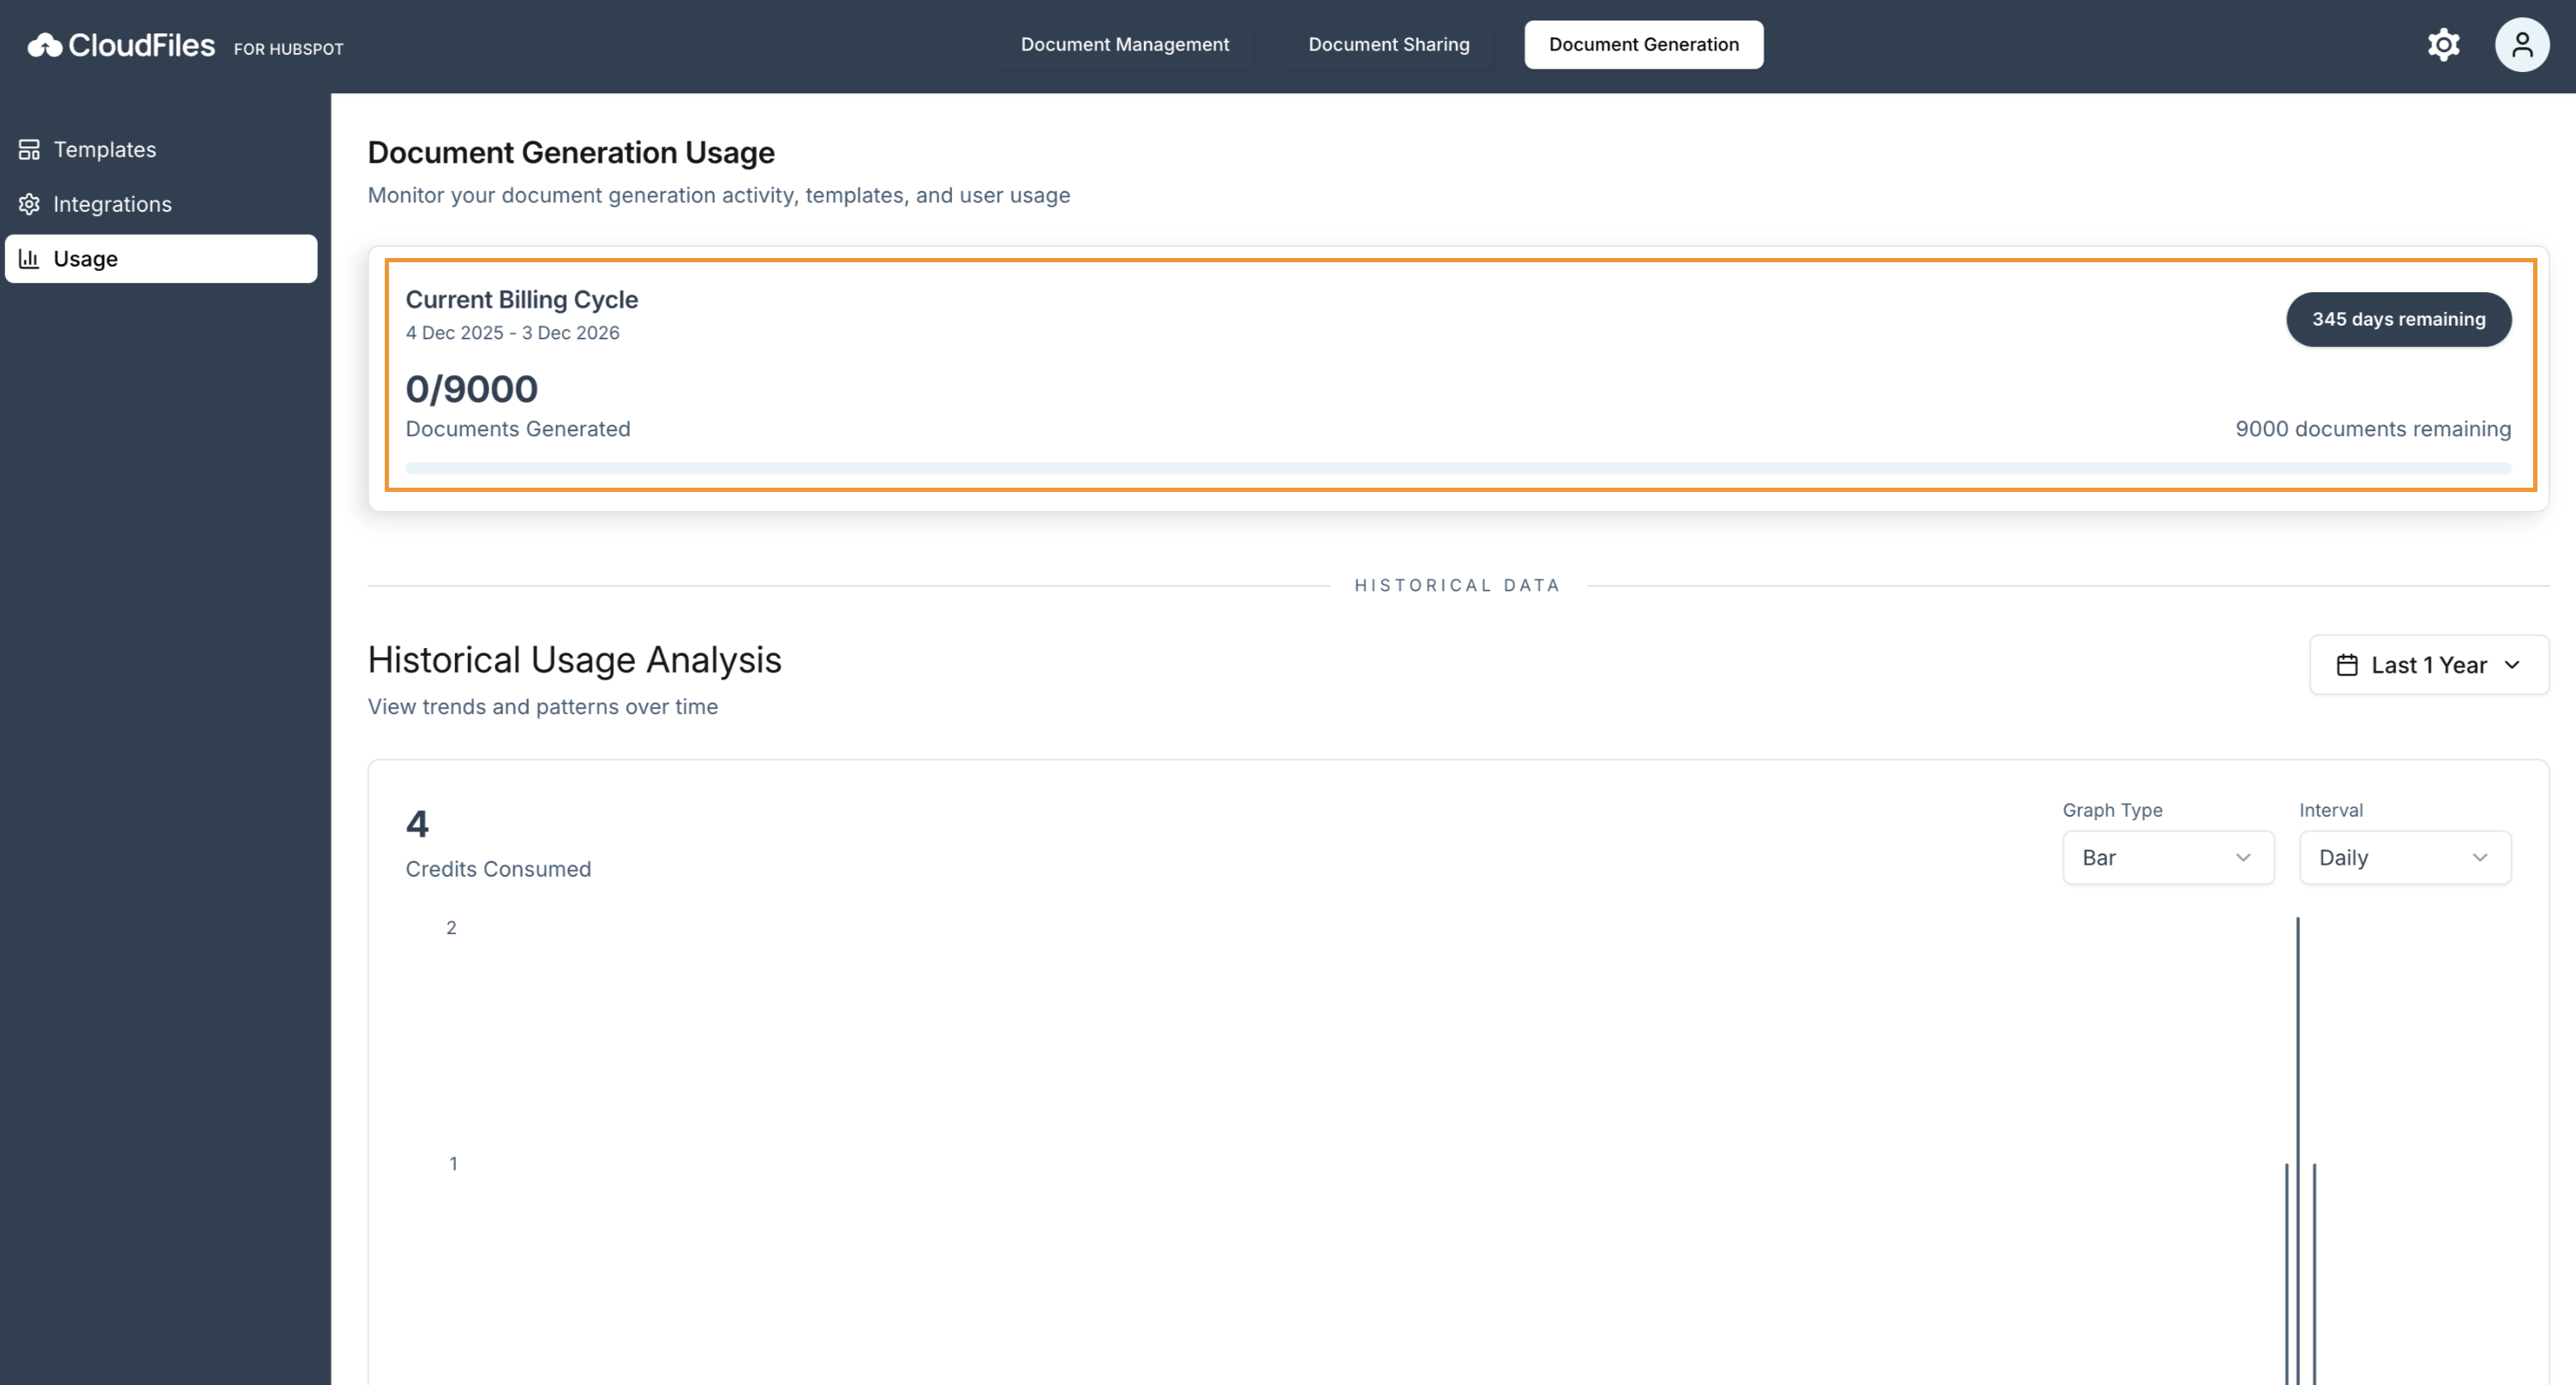
The Usage Summary Card displays a snapshot of usage for the current billing cycle.
It shows the billing cycle start and end dates, the total number of credits consumed so far, the remaining credits available, and the number of days left before the billing cycle resets. This section helps you quickly assess whether current usage is within expected limits.
Purchasing Additional Credits
If your usage exceeds the included limits in your current plan, you can purchase additional credit packs as an add-on.
Document Generation Pack
| Plan | Price/ month | Documents/ month |
|---|---|---|
| Small Pack | $10 | 100 |
| Medium Pack | $75 | 1,000 |
| Large Pack | $500 | 10,000 |
These add-ons allow you to continue generatedocuments without interruption, even during periods of higher usage. Additional limits are applied to your account immediately and are consumed in the same way as your existing plan limits.
Historical Usage Analysis
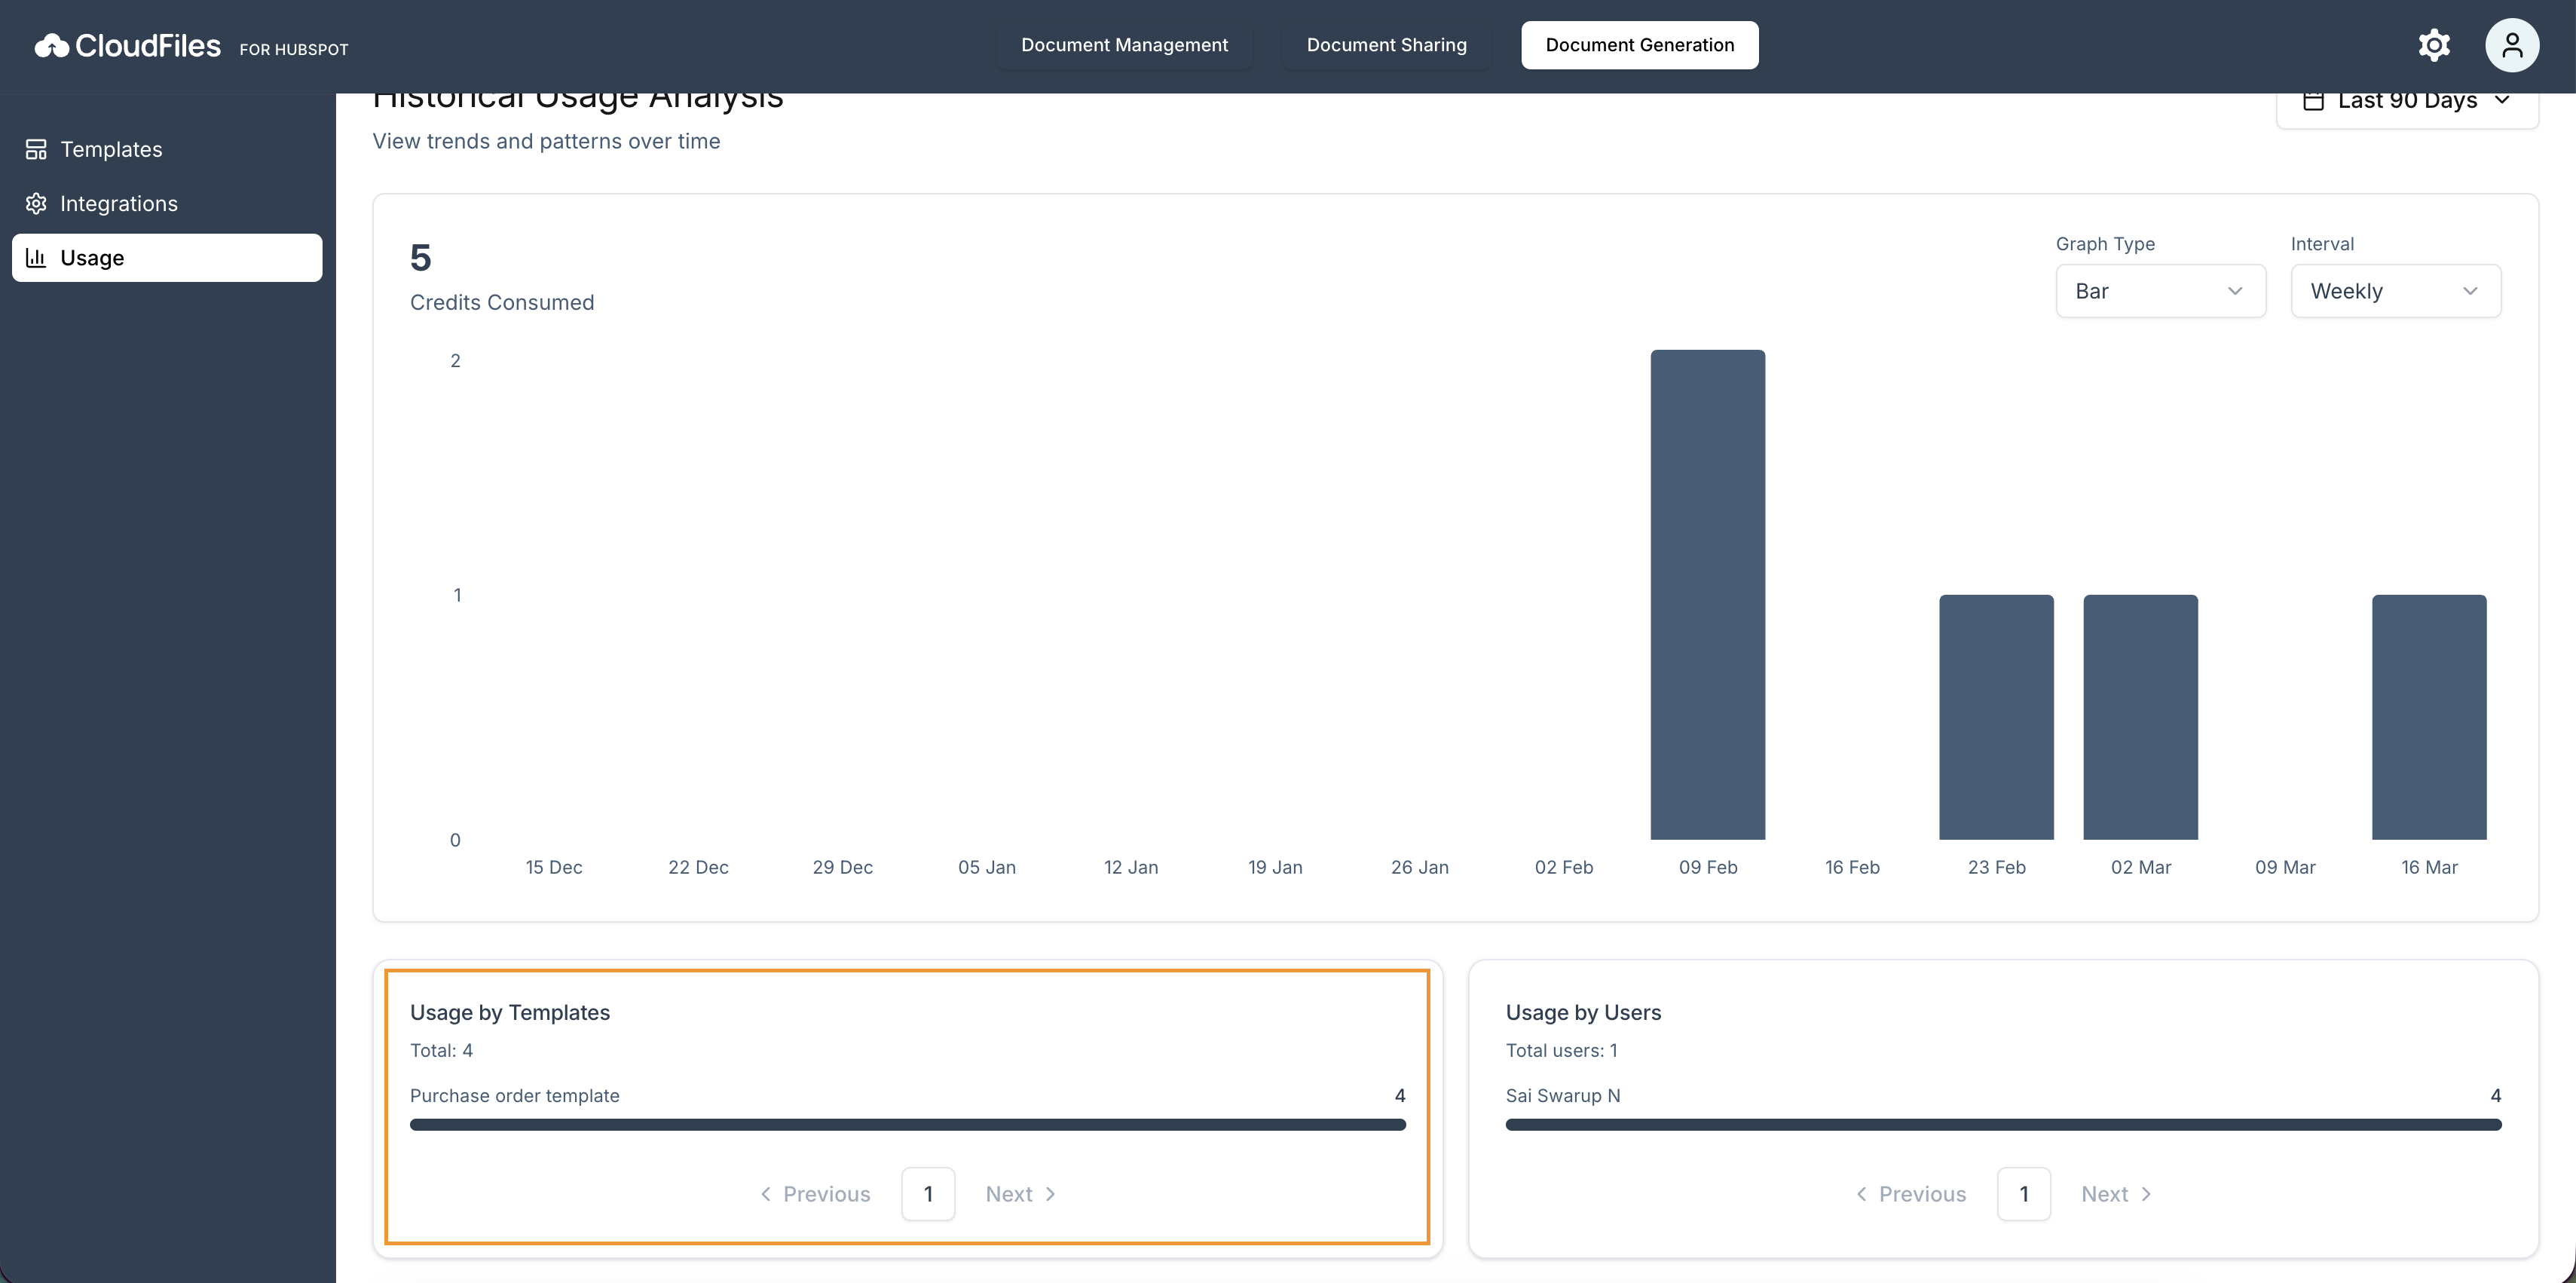
The Historical Usage Analysis section visualises how document management usage changes over time.
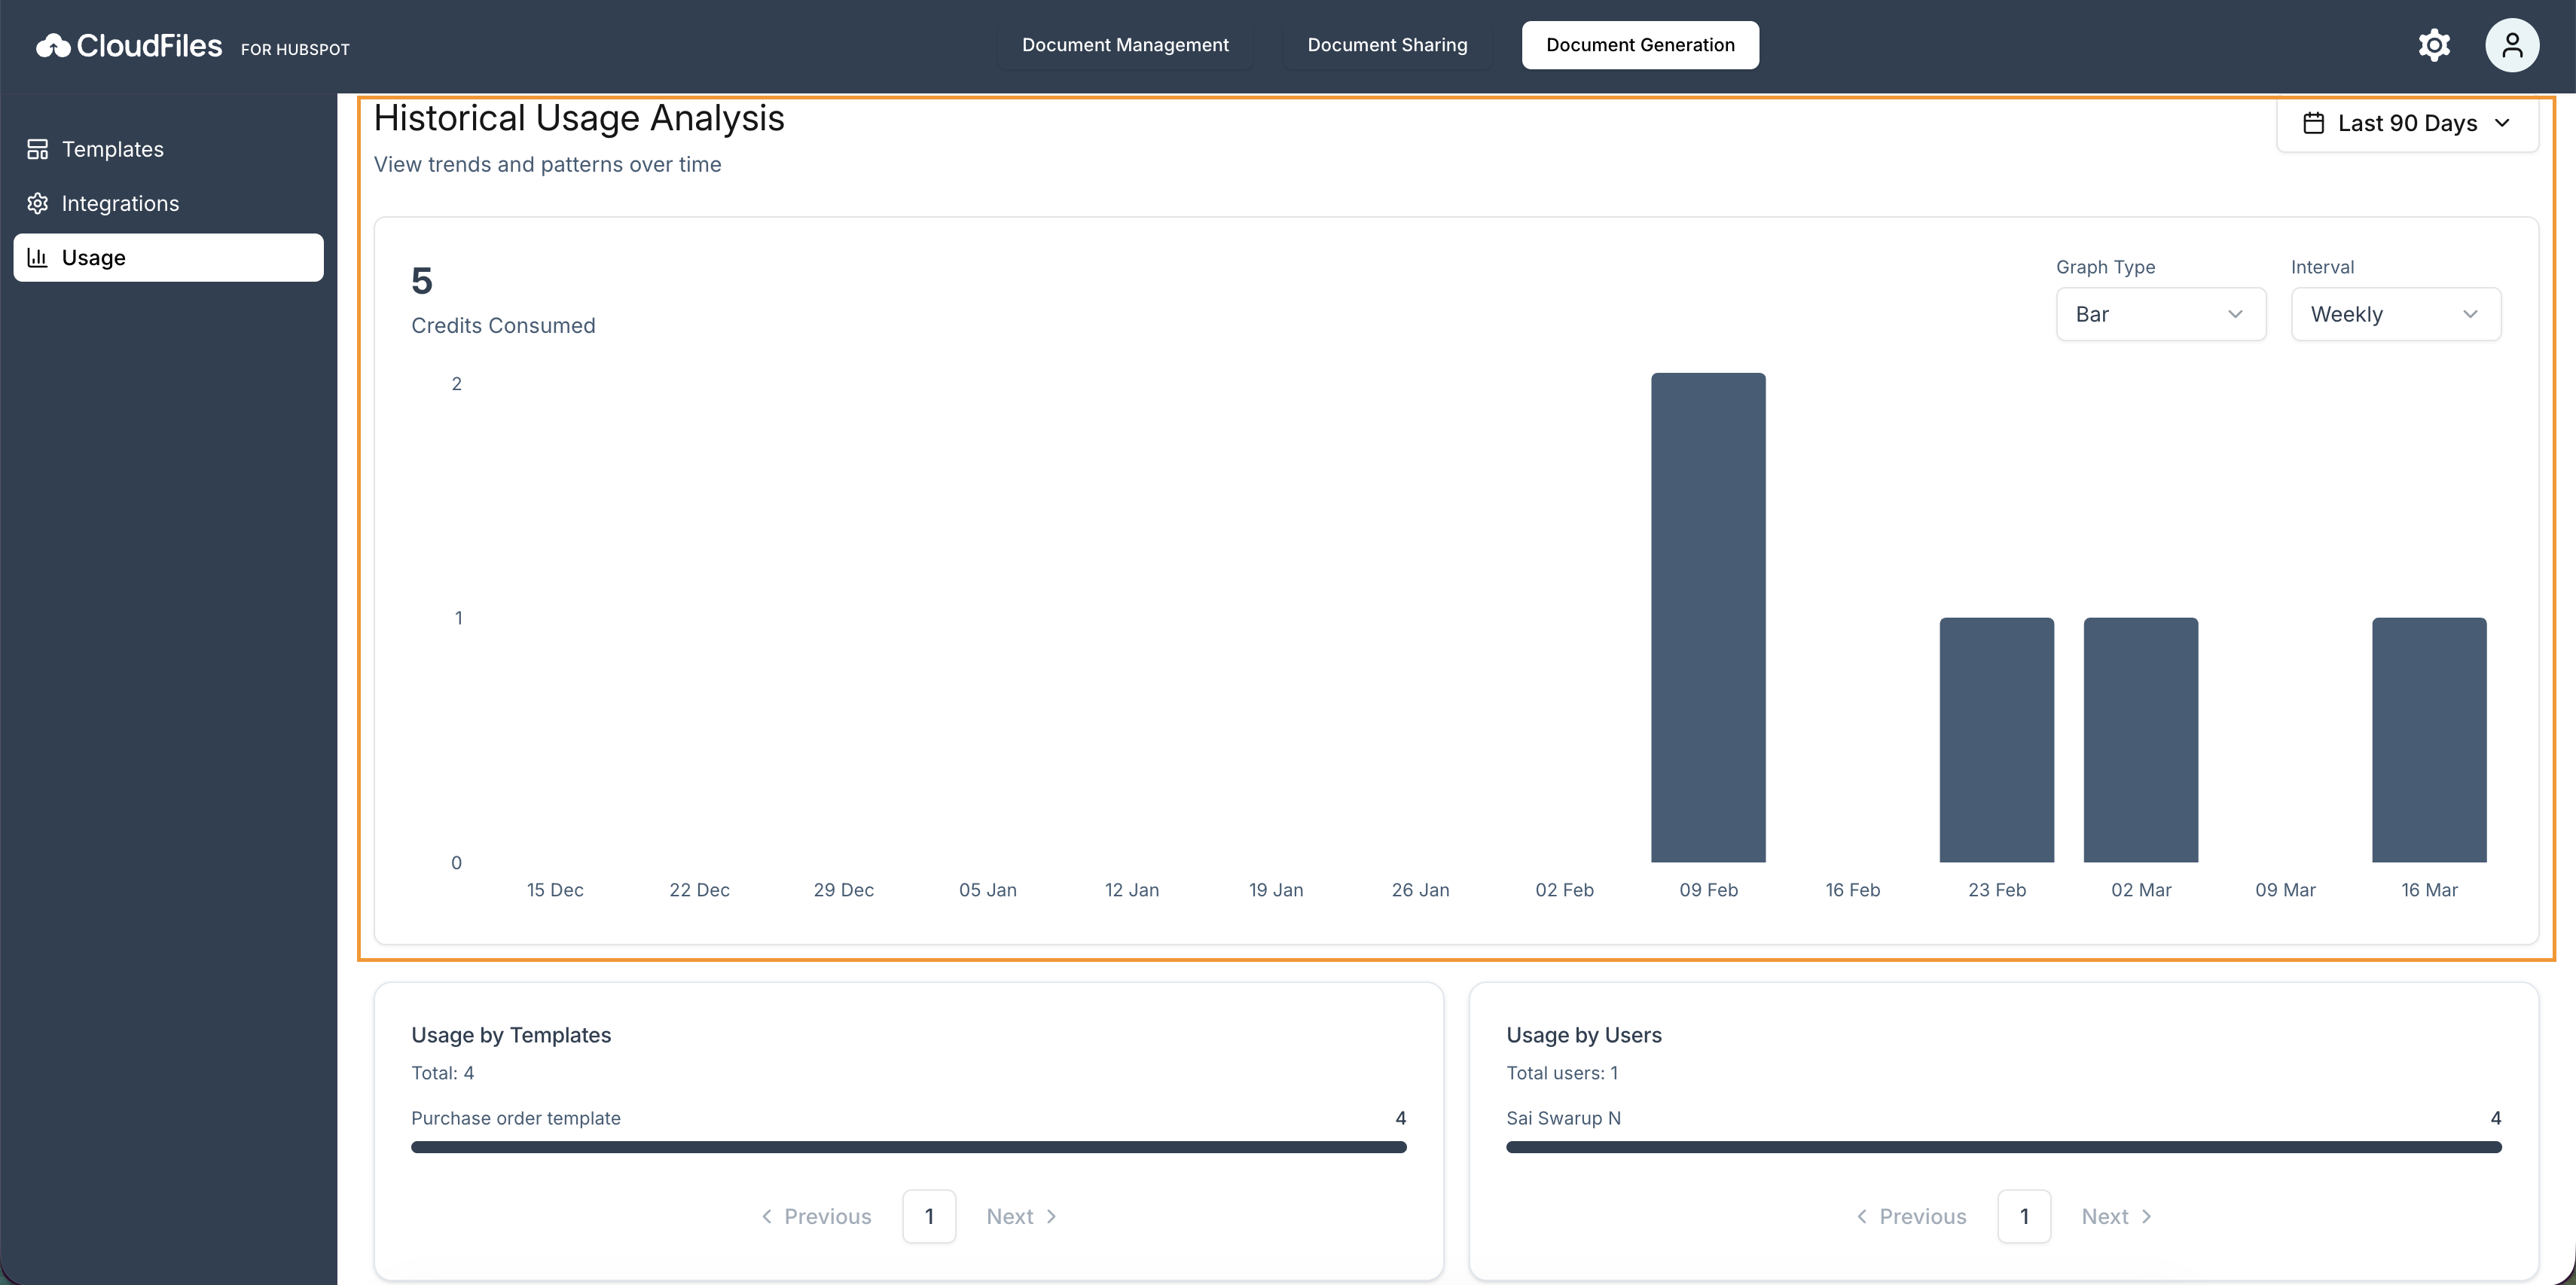
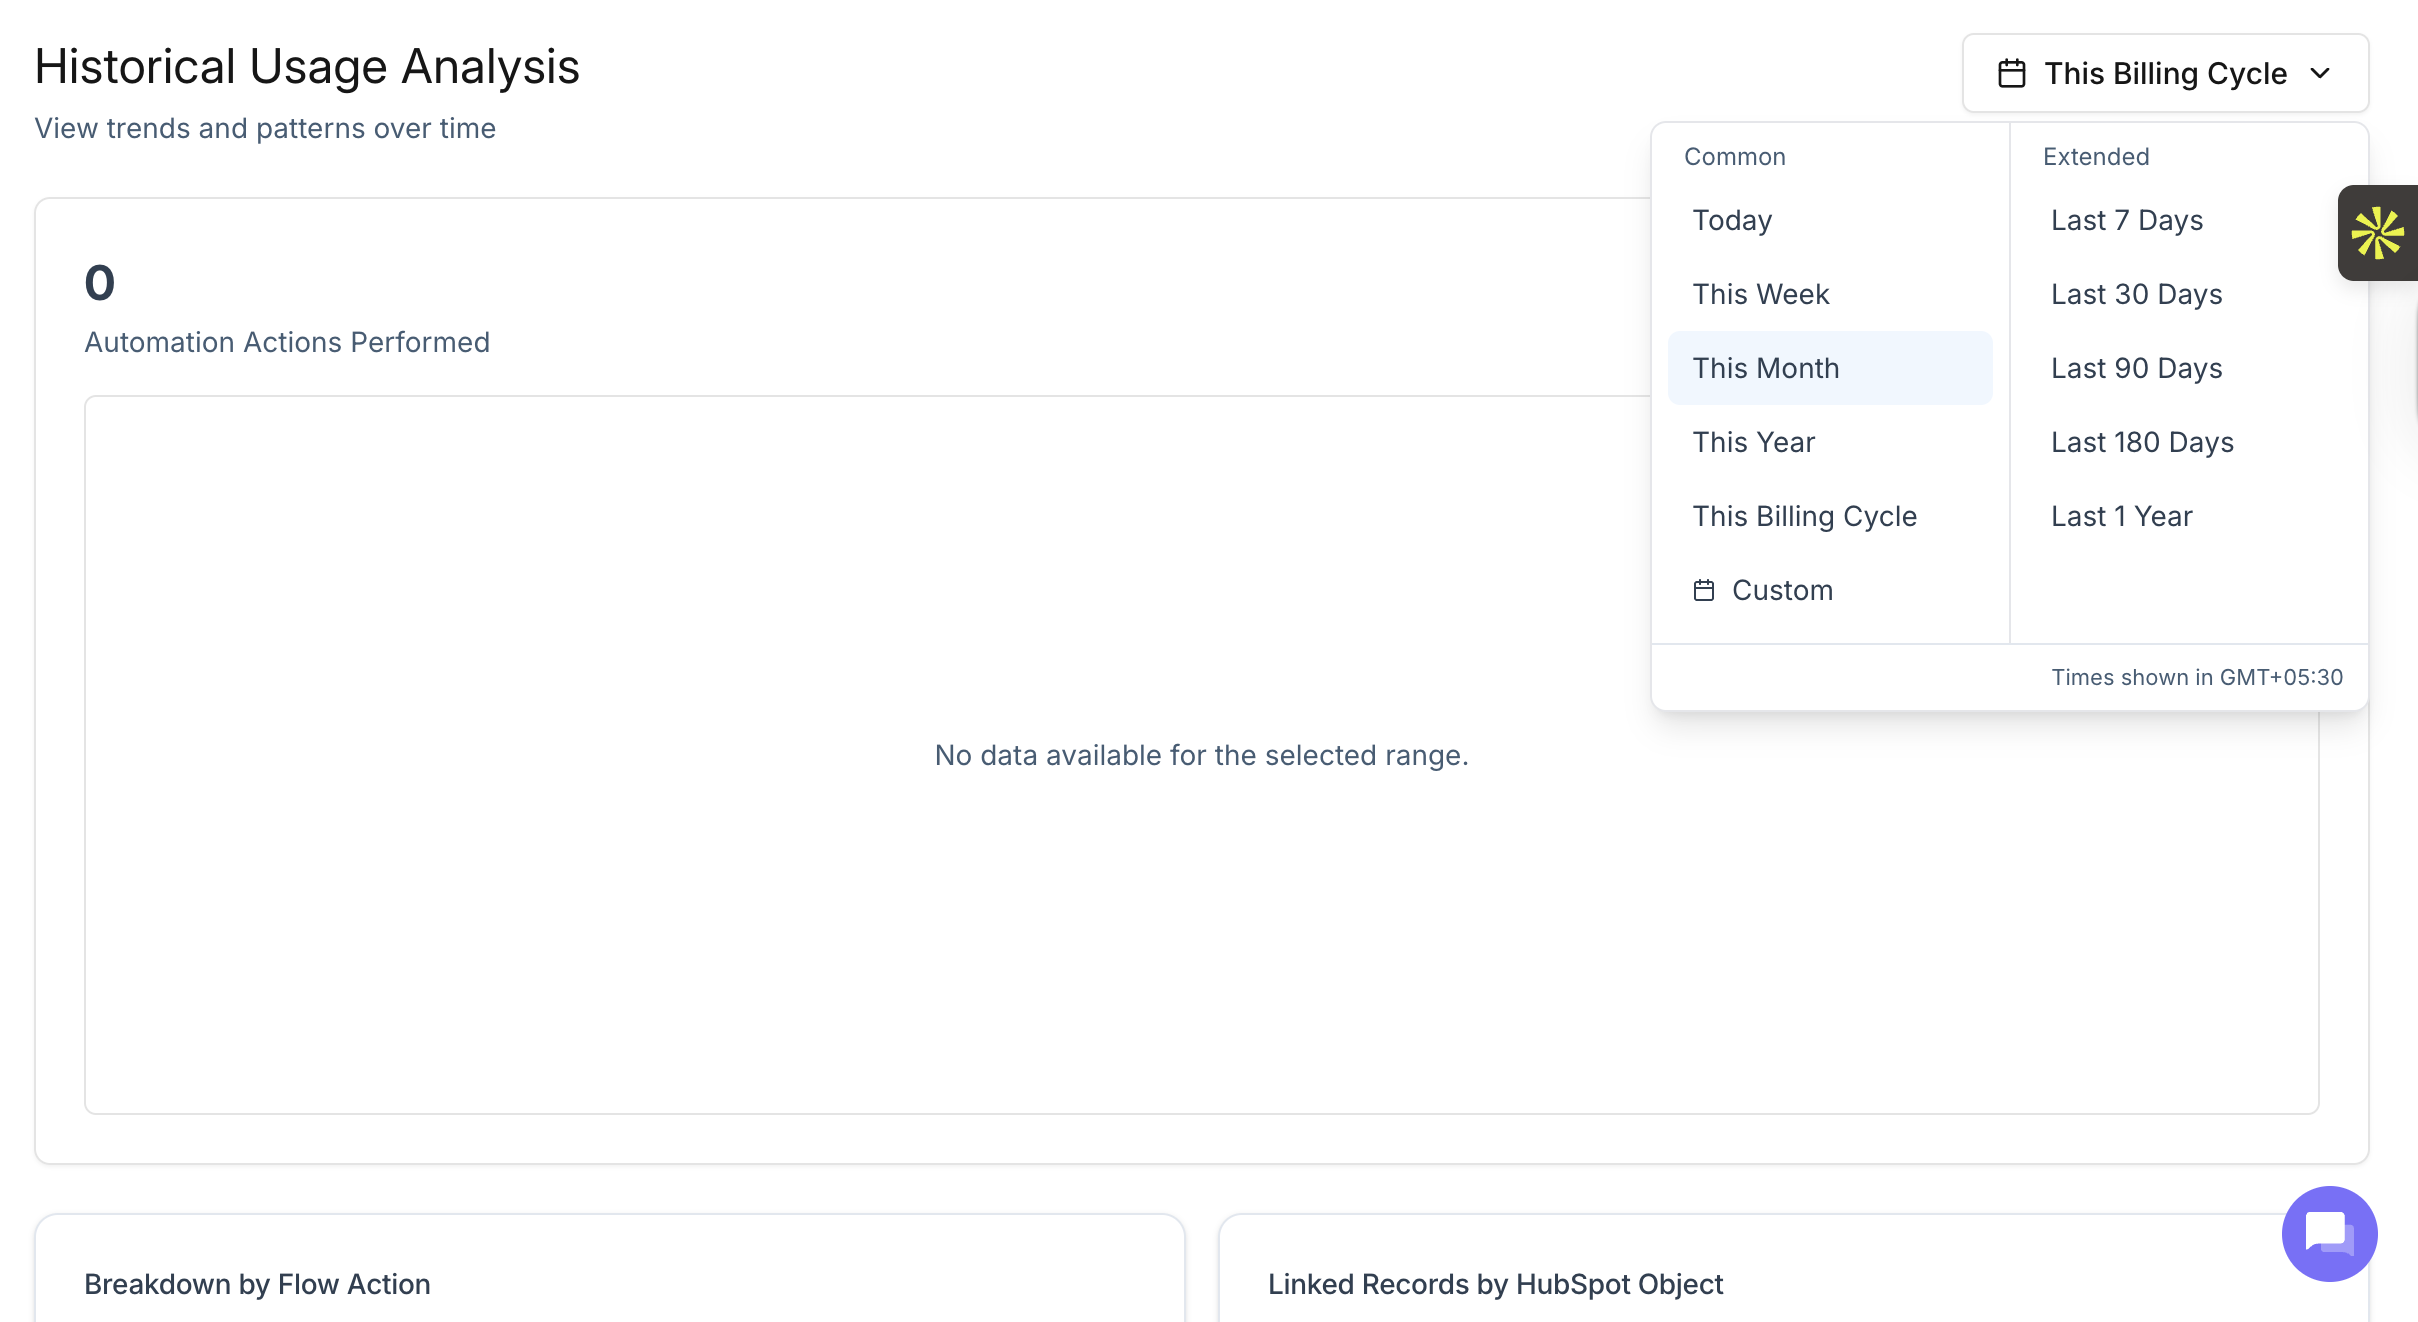
Usage can be viewed across predefined time ranges, such as Today, This week, This Year or Last 180 Days. A Custom Date Range selector is available for more precise analysis. Usage data can be displayed using Bar or Line graphs to identify trends, spikes, and periods of low activity.
Breakdown by Document Templates
The Breakdown by Document Template section shows how usage is distributed across individual document templates used in document generation.
It displays the total number of documents generated using each template. This helps identify which templates are most frequently used in document generations
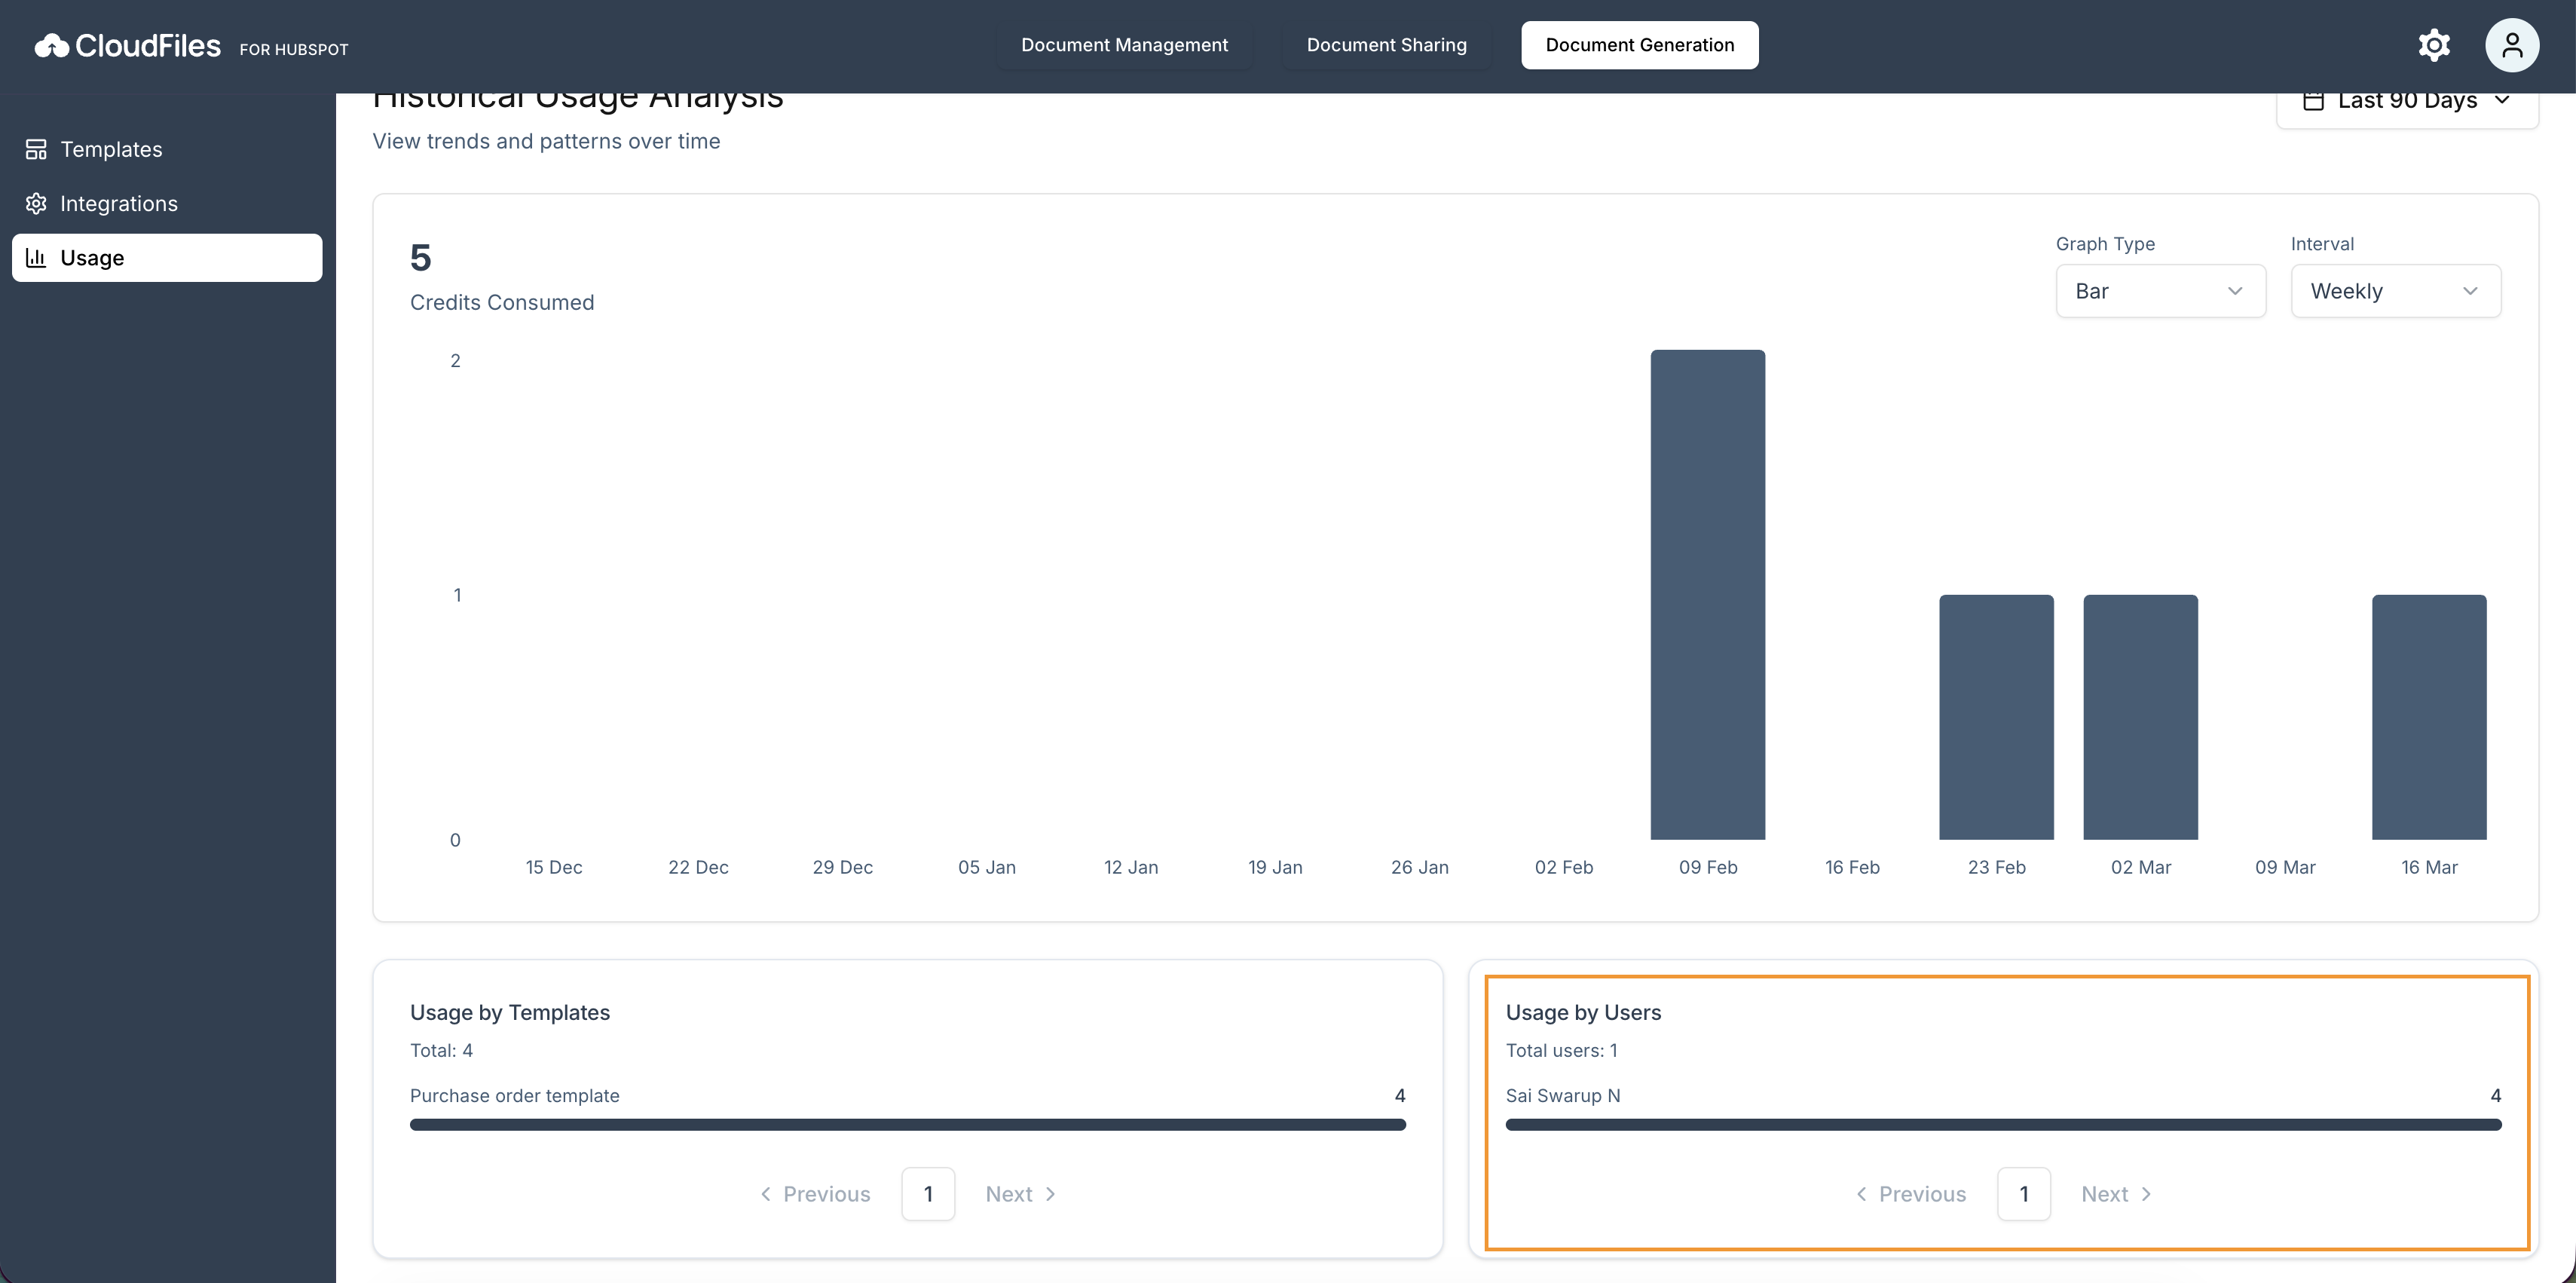
Linked Records by HubSpot User
This section groups usage data by HubSpot users. It shows which users are most frequently triggering document generation actions, either manually or through workflows.
This helps you understand how document generation is being used across your team and identify which users or teams contribute most to overall usage